REPT() in excel
REPT() is a function in excel that specifies repetition. It means that the function repeats the specified characters, symbols, numbers, etc., into the desired number of times.
For example,
Number = 2
Times = 3
Result = 222
Explanation: The Rept() function has first copied the number and inserted it the specified number of times.
Syntax
It is given by:
Where,
Text: It is specified that we want to repeat
Number_times: It specifies the number of times the specified text is to be repeated.
In excel, we declare the above function as:
Output: abcabcabc
Explanation: The text abc is repeated three times. Excel will return the value as abcabcabc.
We can also specify cell numbers in the place of both the parameters of the REPT() function.
Let’s consider another two examples.
- Word = apple
Times = 2
Result = appleapple - Symbol = $
Times = 4
Result = $$$$
We must enclose it in double-quotes whenever we specify symbols or characters separately in the REPT() function. While displaying numbers, REPT() does not require double-quotes.
Let cell B4 contain symbol &. To apply the REPT() function, we can specify it in two ways.
- =REPT(B4, 5)
- =REPT(“&”, 5)
Output in both cases will be: &&&&&
It means that if we specify the cell number in the function, excel will automatically consider it by default.
Remarks
Consider some important points, which are listed as follows:
- It will also repeat 0. But, if the zero is specified in place of number_times in the function, it will return blank or empty text.
- The REPT() value should not be longer than 32,767 characters. The function in such cases returns #VALUE!.
- The specified number in place of number_times should be an integer. In case of the decimal value, excel will automatically consider the integer value.
- The REPT() function does not accept the fraction value in the place of the number_times. But, if we insert the fraction value in place of text, excel will automatically convert it into a decimal value after evaluating the fraction. It will repeat that decimal value the specified number of times.
Examples
Let’s consider some examples based on the Rept() function.
Example 1: Repeating symbols
Solution: Consider the below steps:
- Click on the first cell of the REPT() column where we want to display the repetitive value of the specified text.
- Type ‘=REPT(B3,C3),’ as shown below:
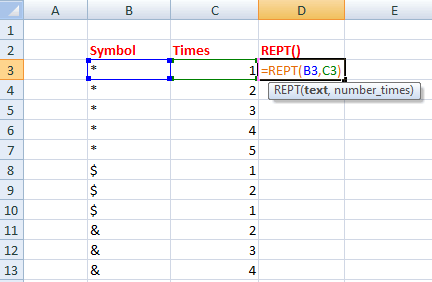
- Press Enter.
Here, we have specified the cell number because it becomes easy to apply the function in excel that has multiple data cells. - Drag and drop-down the first cell to the last cell of the column, as shown below:
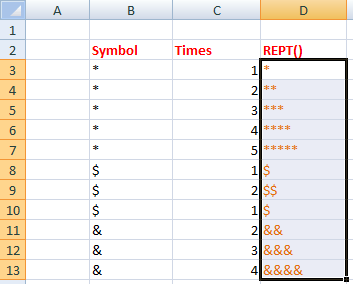
- The function will be automatically applied to the selected cells of the REPT() column.
Similarly, we can use any symbol. The REPT() function separately on each cell will work as:
Example 2: Repeating characters
Solution: Consider the below steps:
- Click on the first cell of the REPT() column where we want to display the repetitive value of the specified text.
- Type ‘=REPT(B3,C3),’ as shown below:
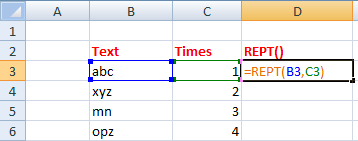
- Press Enter.
- Drag and drop-down the first cell to the last cell of the column. The function will be automatically applied to the selected cells of the REPT() column, as shown below:
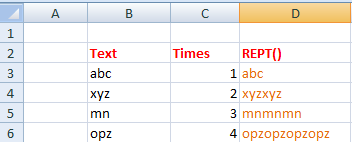
Example 3: Creating a chart as per the given data
Solution: Consider the below steps:
- Click on the first cell of the result column where we want to display the repetitive symbols.
- Type ‘=REPT(“|”,B3/10)’ as shown below:
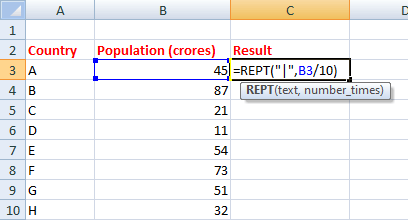
Where,
B3/10, divides the population by 10. It inserts the symbol based on the obtained result (dividing B3 by 10).
We can use any symbol. Here, we have used the ‘|” symbol to display the population of different countries in the form of chart. - Press Enter.
- Drag and drop-down the first cell to the last cell of the column. The function will be automatically applied to the selected cells of the result column, as shown below:
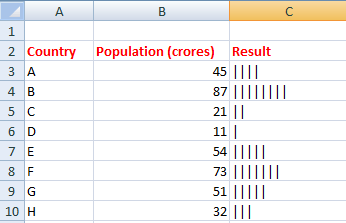
The result clearly shows that country B has highest population and country D has lowest population.


