How to insert a graph/chart in Word
- A graph is a pictorial representation of data and values.
- It provides the easiest way to analyze and read data from the document.
There are the following types of graph that you used in the Word document –
Bar Graph
Bar Graphs are also known as the Bar Charts. Bar Graph is used to represent data and quantities using bars or strips. Bars can be horizontal or vertical. Typically, bar graphs are used in financial analysis and businesses for displaying the data.
There the following steps to insert a bar graph in Word document –
Step 1: Open the Word document.
Step2: Place cursor in the document where you want to insert a bar graph.
Step 3: Go to the Insert tab on the ribbon and click on the Chart option in the Illustrations group.

Step 4: An Insert chart dialog box will appear on the screen. Click on the Bar option from the left side panel and select the chart that you want to Insert. Click on the OK button at the bottom of the screen.

Now, the screenshot shows that a bar graph is added to the Word document, and also a Microsoft Excel file opens with some data.

Line Graph
A line graph is also known as a line chart or line plot. It is used to display quantitative values of data over a specific time interval.
A line graph mainly contains two axes: x-axis (for horizontal) and y-axis (for vertical)
There are the following steps to insert a Line graph in Word document.
Step 1: Open the Word document where you want to insert a line graph.
Step 2: Go to the Insert tab on the ribbon and click on the Chart option under the Illustrations group.
Step 3: An Insert Chart window will appear on the screen. Select the Line option from the left pane and pick a line graph that you want to insert. Click on the OK button at the bottom of the screen.

The screenshot below shows that a line graph is added to the Word document with some dummy data.

Create a Scatter Plot Chart in Microsoft Word
Microsoft Word provides an ability to create an XY scatter plot.
Follow the below-mentioned steps to create a Scatter Plot chart in Word document –
Step 1: Open the Word document.
Step 2: Go to the Insert tab on the ribbon and click on the Chart option under the Illustrations group.
Step 3: An Insert Charts dialog box will appear on the screen. Select the XY (Scatter) option from the left pane and pick a line graph that you want to insert. Click on the OK button at the bottom of the screen.

The screenshot below shows that the graph is inserted into the Word document based on the Excel sheet data.

Insert a Pie chart in Word document
A Pie chart is used to display data and information in the form of a pie slice (circular graph).
There are the following ways to insert a pie chart in Word –
Step 1: Open the Word document.
Step 2: Place the cursor in the document where you want to create a pie chart. Now, Go to the Insert tab and click on the Charts icon under the illustrations group.

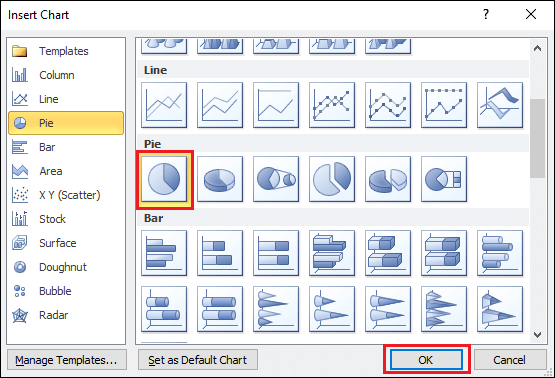
Step 3: An Insert chart dialog box will appear on the screen. Choose any pie chart that you want to insert in Word document, and click on the OK button at the bottom of the screen.

Once you click on the OK button, a Pie chart and excel document will appear on the screen, as shown in the below screenshot.


