How to Insert Chart
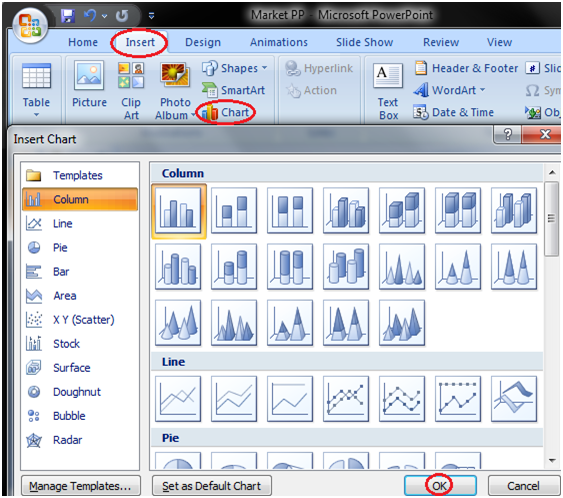
- Select the Insert tab
- In Illustrations group click on Chart command
- An Insert Chart dialogue box appears
- Select the desired Chart style and click Ok
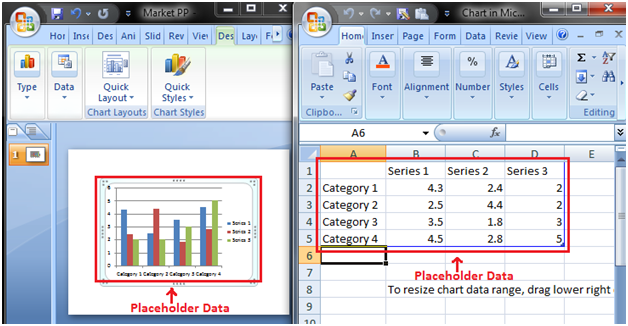
- Chart will be added to slide and an Excel worksheet appears on right side of the slide
See the images:


Next TopicHow to Enter Chart Data


