How To Zoom In Graph In Excel
The most important in charting is visibility. In this lesson you will learn how to zoom in your graph.
Zooming Sheet
The easiest way is to zoom in the Sheet. To do it go to right corner of screen and click + button
It makes whole Sheet bigger. Chart will be bigger too.
Changing scale of axis
Other method is to change scale of axis. Excel automatically fits scale of axis.
If your chart looks that:
You can change it to that look:
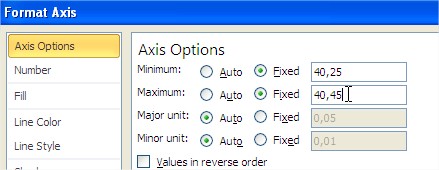
You can easy improve wrong scale yourselves. Right click axis and select Format Axis.
Change Min and Max values to fit them to your values.

Notice that scale of proper axis starts from $40,25. You don’t need to starts from $0.
Using logarithmic scale
The other way is using logarithmic scale. Use logarithmic scale when there is huge difference between values at your graph.
Right click axis and next Format Axis. Tick Logarithmic scale check box.
Now graph looks much better. Every 3 lines are visible well.
Template
Further reading:
Basic concepts
Getting started with Excel
Cell References


