MEDIAN Function In Excel
The Median is just the middle value in a set of numbers. But if there is no middle value in the set, median is an average of two middle values.
- MEDIAN of (1, 2, 3, 4, 5) equals 3
- MEDIAN of (1, 2, 3, 4, 5, 6) equals 3.5 which is an average of 3 and 4
The syntax for the MEDIAN function is:
=MEDIAN(number1, [number2, …])
Number 1: This is required.
Number 2 – 255: This is optional, going all the way to 255, for which the user wants medina of.
You can use up to 255 numbers in your MEDIAN formula.
Median of an odd number of values
In case of odd number of values, median is just a middle value.
Median of an even number of values
In case of even number of values, median is average of two middle values. Here it is average of 3 and 4, which is 3.5.
Median of selected cells
You can type addresses of cells for which you want to calculate median in Excel.
Median of typed numbers
Instead of addresses you can also use number. Using this method you don’t need any table of data. Notice that formula is not connected with column A in the picture.
Median – Mix of above examples
You can also use all above methods together.
Simple Median Formula
We are have different data of our sales management, and we would like to know the median of the sales department. This help in acknowledging how we are averagely performing. It help in reaching our next goal.
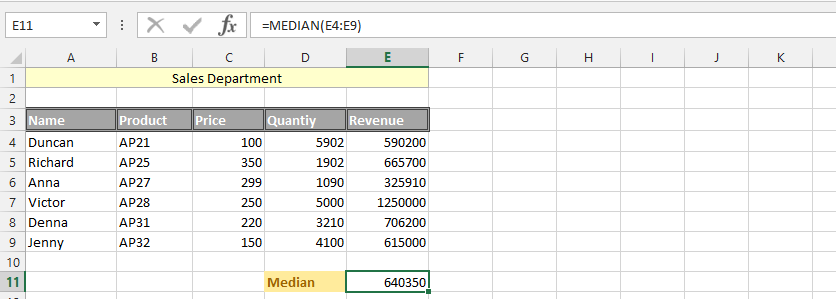
Median and 25%
The goal has been set, and we would like to know how we would be able to do in our next goal. Annually, we look at various aspects in our business, and determine if we have reached our goal for that year. We have determine that every year, we would like our median to increase by 25%, and we want to know this median, for that reason, we are going to use the previous data to acknowledge if the 25% has increased or not.
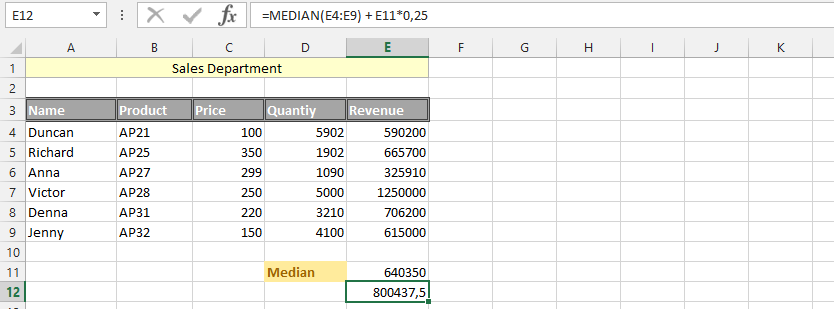
Median and Sum
The business needs to pay its debt on an average level, and we need to make sure that the business works excellently in form of finances. It is why we have been looking at the business, but the tax office is much more interested in the average performance this time. This is why we have decided to check if the median could cover the expenses.

Median with Text
The whole data has been inputted in text, and it is crucial that we’d decide what would work best for the circumstances. Our data is layout, and now we would like to determine the median, using the label we have given to our data.

Medium Capacity: Phase 1
Generally, we believe that the medium should have the ability to pay at least the maximum expenses in the range of our total expenses. However, we do not know how the medium would perform under the circumstances, which is why we are using the medium and max to find out.
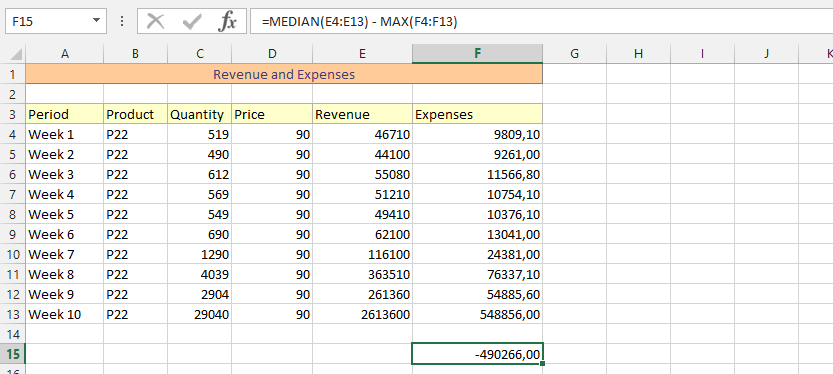
Medium Capacity: Phase 2
As it was shown in the previous example, the median is not doing well with the evaluation, which is why we believe that the evaluation should continue, because we cannot tolerate such high expenses. This is why we want to see how the median would perform in a different evaluation: median and min.
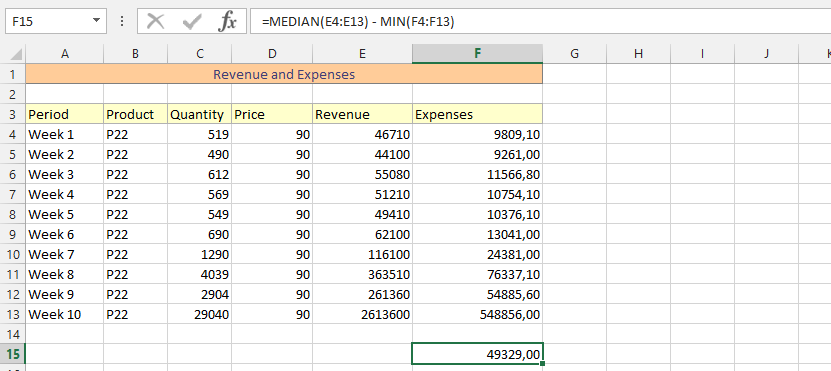
Medium Capacity: Phase 3
The phase three is now about being fair, using previous data, and use it to find the appropriate answer to how the medium is performing. This is why we are now going with a medium minus medium in the data.
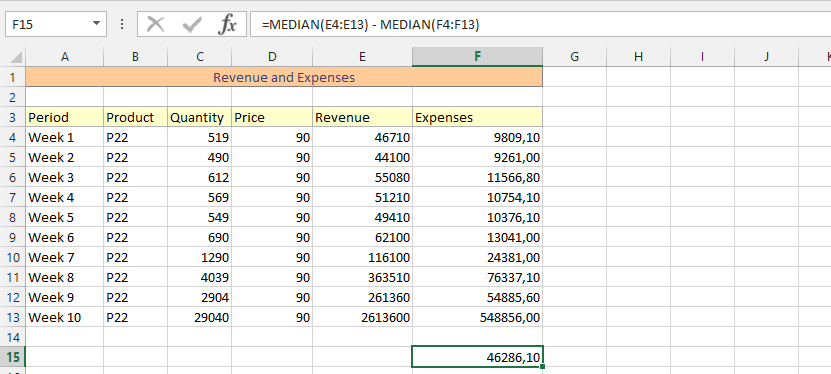
IF and Median
We have a specific goal for the business, and throughout the months in the year, we have followed the business’ process. Every month we have made specific amount, which is why we’d determine that if we make a specific money the last month of the year, then we need to know the median, so we can see if the median we have determined has been reached.

Median and Average
The data has been layout, and we are trying to see the median and average of both expenses and revenues, which is why we are using both formulas to find out how it would work out.

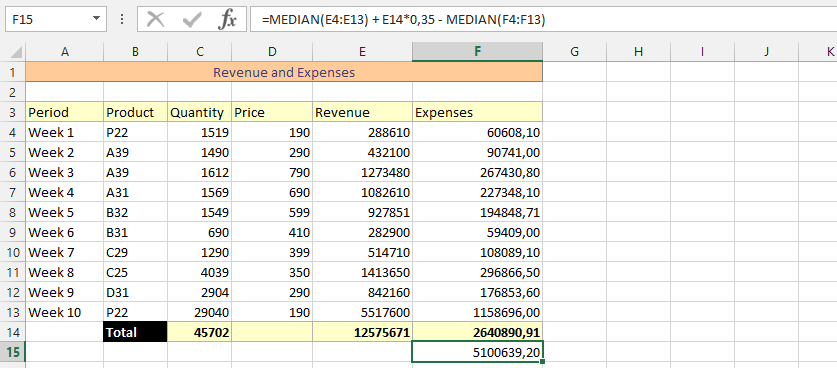
Double Median and Percentage
The business needs answers of how it would perform, and because we would like to know what would happen if we add 35 percent that an investor was going to pay us, and then remove the median again, the business might be able to do the median for finding the answers we want.
Template
Further reading:
Basic concepts
Getting started with Excel
Cell References


